Help
Introduction
Astronomical observatory in Ondřejov, a little town located 35 km south east from Prague (Czech Republic), was founded in 1898 as a private observatory. In 1928 the observatory was donated to state and Charles University, and from 1954 it became a part of Astronomical Institute of the Czech Academy of Sciences (ASU CAS). The first observation of the Sun in Ondřejov started in 1944 and nowadays the observatory, and its Solar Physics Department, has a long tradition of different kinds of solar observation and studies. In 1984 Solar Patrol Service (SPS) was established within the department and since that time, unfortunately with some breaks, it has been monitoring the Sun and compiling solar activity reports and flare forecasts (www.asu.cas.cz/~sunwatch/).
Weekly flare forecasts were produced since 1978. In 1981 the daily forecasts of solar activity level were added. The daily flare forecasts for the full disc are provided since 2013, but the flare forecasts per active regions were produced irregularly only (weather limited). The form and the content of the forecasts underwent several changes during the years.
Nowadays SPS offers two types of flare forecasts: for full disc and per active region. For both forecasts the flare probabilities are issued in percent for classes C, M, X, respectively.
The experienced observer/forecaster on duty daily evaluates the latest SPS sunspot drawing (Figures 1, 2) and relevant publicly available data to make an expert judgment of all observed active regions. The crucial attention is paid to evolutionary changes in each observed active region. The observer/forecaster visually follows rapidity in morphological changes of sunspots, evolution of their McIntosh classification, complexity and changes of longitudinal magnetic fields in active regions (SDO/HMI). Also a visual inspection of appearance of coronal loops in individual active regions (e.g. SDO/AIA, STEREO/SECCHI-EUVI) is also taken into account when casting the percentual probability of flare occurrence. Unfortunately, no validation of SPS flare forecasts has been published so far.
The flare forecast per active region provides NOAA active region numbers and Stonyhurst heliographic coordinates at the time of NOAA observation, SPS internal archive number of an active region, Stonyhurst heliographic coordinates at the time of SPS observation, and C, M, X flare probabilities given by the observer/forecaster on duty. The information per active regions is then statistically combined to provide the flare forecast for the full disc. Forecasts are issued at 17:00 UTC daily and are valid for next 24 hours from the time of the issue.
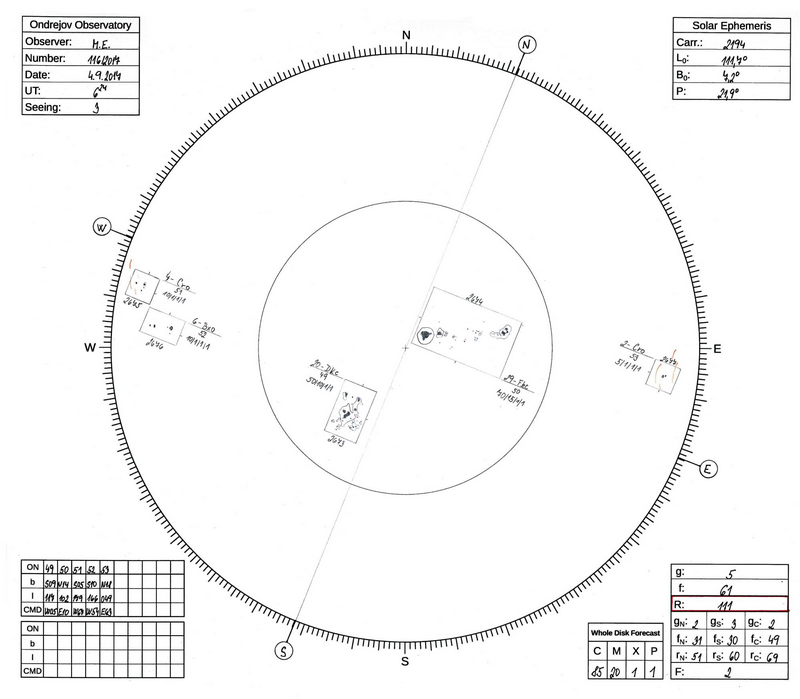
Figure 1: Example of a drawing made by an observer of SPS on September 4th, 2017 at 06:24 UTC.
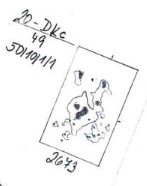
Figure 2: An example of a detail of an active region from the drawing in Figure 1. The label explanation: "20 - Dkc" - "20" is total number of sunspots in active region; "Dkc" is McIntosh classification; "49" - is an SPS internal archive number; "50/10/1/1" - is probability of occurrence of solar flares of class C/M/X/proton in percent, respectively and "2673" - is NOAA active region number.
|
Class |
Peak flux range [W/m2] between 1 and 8 Angstroms |
|
C |
10-6< = I < 10-5 |
|
M |
10-5< = I < 10-4 |
|
X |
I > = 10-4 |
Table 1: Definition of GOES soft X-ray of flare classes C, M, X.
Technical information
This product consists of a header and two parts: Full Disc Forecast and Per Active Region Forecast.
The header includes:
Date and time of observation – YYYY-MM-DD and hh:mm UTC. Date and time of SPS sunspot drawing. When not available, time 00:00 UTC is used.
Issued – 17:00 UTC
Observer – name
Seeing conditions – very poor - 1, poor - 2, fair - 3, good - 4, exceptional - 5. When not available, the column is filled with the "-" symbol.
Analyzed Data – Sunspot drawing obtained at SPS and various. By "various" we mean various publicly available relevant solar data, especially when SPS drawing is not available.
Relative sunspot number – Relative sunspot number based on sunspot drawing obtained at SPS. When not available, the column is filled with the "-" symbol.
Activity level – The overall activity level. Five standard terms are used to describe the activity observed or expected within a 24 hour period:
1 – Very low – X-ray events less than C-class
2 – Low – C-class X-ray events
3 – Moderate –isolated (1 to 4) M-class X-ray events
4 – High –several (5 or more) M-class X-ray events, or (1 to 4) M5 or greater X-ray events
5 – Very high – several (5 or more) M5 or greater X-ray events
Columns of tables are:
Full disc
C, M and X – probability of solar flares in percent [%]: classes C, M, X, respectively.
Per active region
NOAA no. – NOAA region number. In case of a new region without NOAA region number the dash sign "-" is used.
NOAA LOCATION – Location of active region provided by NOAA/SWPC: Carrington heliographic latitude and central meridian distance (known as Stonyhurst heliographic longitude) at a given time. In case of missing NOAA location of an active region "-@- UTC" is used.
ONDREJOV no. – Internal archive number which is provided by SPS. Each year our internal archive numbers start from "1" since January 1st and ascend till December 31st. When not available, the column is filled with "-" symbol.
ONDREJOV LOCATION – Carrington heliographic latitude, central meridian distance (known as Stonyhurst heliographic longitude) at a given observation time. When not available, the column is filled like "--@2022-02-05 00:00:00 UTC".
C, M and X – probability of solar flares in percent [%]: classes C, M, X, respectively.
Limitations and caveats of the product
Flare forecast is influenced by the observer’s/forecaster’s subjective judgment and experience.
The observation of the Sun can be carried out from 04:00 – 17:00 UTC in summer and from 08:00 – 13:00 UTC in winter at SPS site. During this time interval the Sun is monitored and the drawing can be obtained. The service is provided 7/7, holidays included. The date and time of observation, together with seeing conditions, can be found in the header of the product. Even the SPS sunspot drawing was obtained early during the observation time, the SPS forecasts also reflect the flaring activity up to its regular issue time (17:00 UTC).
When SPS data (sunspot drawing, synoptic images) are not available, we utilize various publicly available solar data (NOAA/SWPC, NASA/SDO, NASA/STEREO) for the preparation of the product.
Use and functionality of the product
The Latest tab displays the set of the latest flare forecasts available. These are updated daily at 17:00 UTC and are valid for 24 hours from its issue time. The data are also available in XML format via the API. The XML output format is widely used and has been developed in a collaboration with CCMC (Community Coordinated Modelling Centre, NASA).
The Query tab provides an access to archived flare forecasts since January 2022. By default it lists the last 10 days of observations. The list can be filtered out by providing start and end dates entry in the format YYYY-MM-DD. For example, entering the start date 2023-01-01 and end date 2023-01-30 and clicking the submit button will return all of the data available from January 2023. The data are also available via the API (probabilities in XML files are in decimal numbers).
Alert Subscription is not available for this product.
The top menu navigation bar allows to browse through the products as follows:
Latest
Switch to page showing the latest data.
Archive
Switch to page offering archive query functionalities.
Alert Subscription
Switch to page for email subscription of service.
Help
Provides more details on the data products, their properties, constraints and access methods, the providing Expert Group as well as this general help on navigation.